Bitcoin price has dropped about 63% in the last few months. Bitcoin is currently trading around $30,000. Support around $28,000 held during the last crash. But how long will this take?
We offer you an analysis of how Bitcoin could continue. We also provide you with information on when the Bitcoin price may bottom out. It is likely that the price will drop a little more. but why ?
Bitcoin’in dibini tahmin etmek için hangi gösterge kullanılabilir?
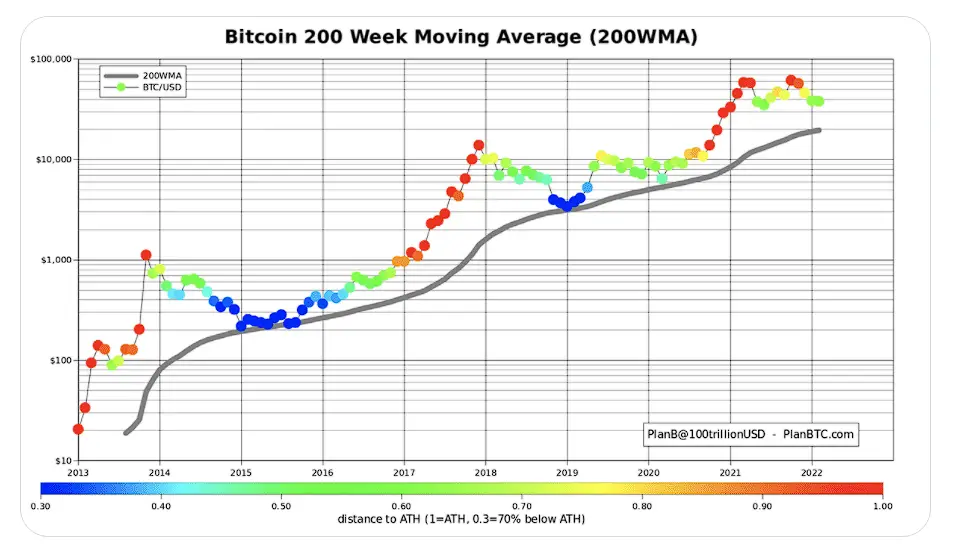
Historically, Bitcoin price has always been able to find support at the 200-week moving average line after the bear market has passed and it has not dropped below this line. Therefore, again, we assume that the Bitcoin price will not fall below the 200-week moving average line.
That’s about $22,000 right now, so the price could drop by around $8,000 in the near future. Therefore, we think that the Bitcoin price has not bottomed out yet and will fall further. The target is currently around $22,000 for a bottom.
We also have to mention the Terra Luna crash that affected the crypto market badly and discredit most trusted crypto currencies. It only takes one bad news to collapse all market.

When can we expect Bitcoin to hit $22,000?
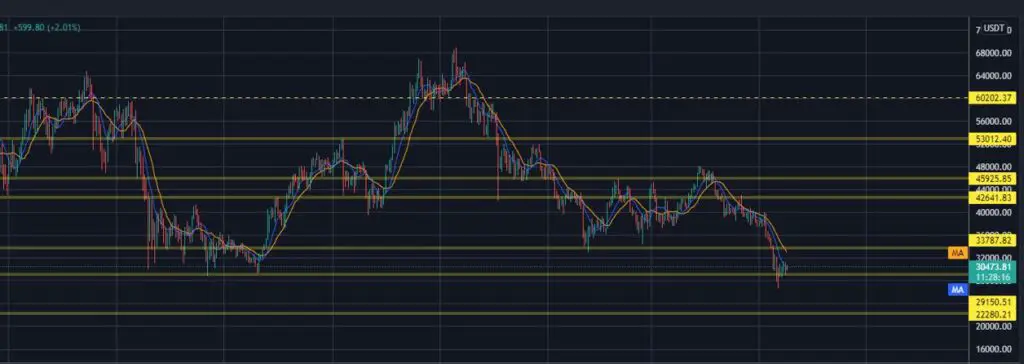
As long as Bitcoin holds the $28,000-30,000 support zone, we do not expect the price to drop to $22,000. However, once this support is broken, we strongly expect the price to drop to $22,000 in the next few days after the support is broken. However, we can say that if it draws a weekly horizontal chart at 30,000 price line, it will rise rapidly.
What do the market analysts think?

The cryptocurrency market continues to try to find its direction. While many crypto experts state that bitcoin will fall in the range of 15-22 thousand dollars, others state that it will rise to a price in the range of 36-48 thousand dollars and will be traded at these levels.
Bitcoin price has been stuck in the range of 26-33 thousand dollars recently, it is constantly rising and falling. The recent events in ust and luna and the sale of reserve bitcoins by top investors caused the market to turn upside down. The fear of fud, which was trying to dominate the market, peaked with the luna case and bitcoin declined to 25 thousand levels. It continues to be traded in the range of 27-32 thousand dollars with subsequent purchases.
When we look at the Bitcoin price chart, it is a negative situation that ma 9 is below ma 16 (orange line). Most of the indicators give bearish signals. The Bitcoin price will break the 32 band and reach the 38-42 thousand dollar band in a short time, and this negative atmosphere will disperse.
(image Source: Tradingview charts)
Not Investment Advice
The information provided in this article is for general guidance and information purposes only. The content of this article is in no way intended to be construed as investment, business, legal or tax advice. We take no responsibility for individual decisions made based on this article, and we strongly recommend that you do your own research before taking any action. Despite best efforts to ensure that all information provided herein is accurate and up to date, omissions, errors or inaccuracies may occur.
Disclosure: The authors invest in cryptocurrency projects and have crypto assets, including those discussed on this website.


